Globally, healthcare accounts for 4.4% of the worlds’ carbon emissions, and in the UK, the NHS produces 5.4% of the UK’s greenhouse gas emissions. The NHS is also responsible for 3.5% of all road travel in England, producing significant air pollution.
In October 2020 the Greener NHS released a report detailing plans to become the world’s first ‘net zero’ health service by 2040. Building on work being done by trusts across the country, Greener NHS is sharing ambitious plans and ideas on how to reduce the impact on public health and the environment and also save the NHS money.

There have also been recent success stories, with multiple trusts and several Royal Colleges declaring climate emergencies, and beginning to make major changes in the way they operate to reduce their footprint.
NHS England’s carbon FOOTPRINT:
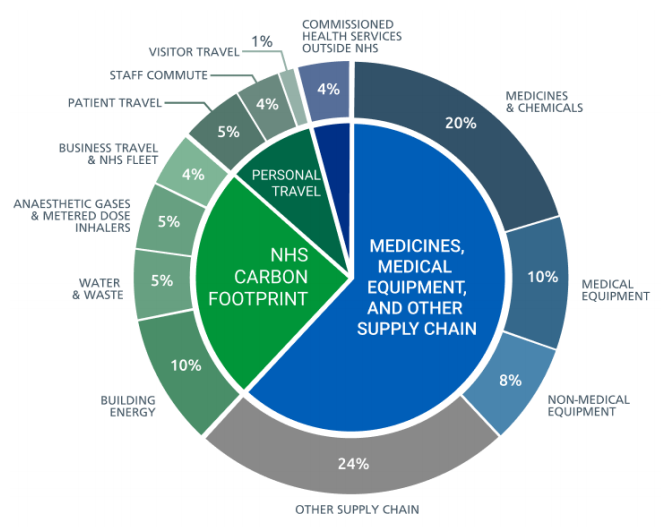
The biggest contributors to total emissions in the UK Health and Social Care are in the supply chain (so called ‘scope 3’ emissions) with the biggest chunks being medicines and chemicals (20%) and medical equipment (10%). However, in order to meet the ‘net zero’ pledge every contributor will need to be addressed.
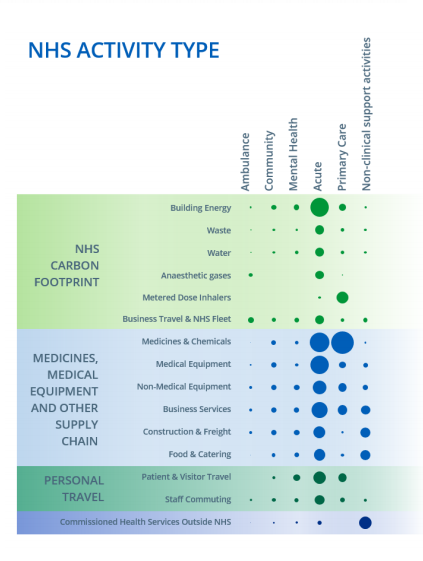
There is substantial variation in carbon ‘hotspots’ across different NHS settings. For example, in the infographic below you can see how in acute sites, building efficiency and equipment plays a large role, whereas prescribing and inhaler choices are proportionally more significant in primary care.